Within Comparisons
Why Most Feature Tables Are Too Long
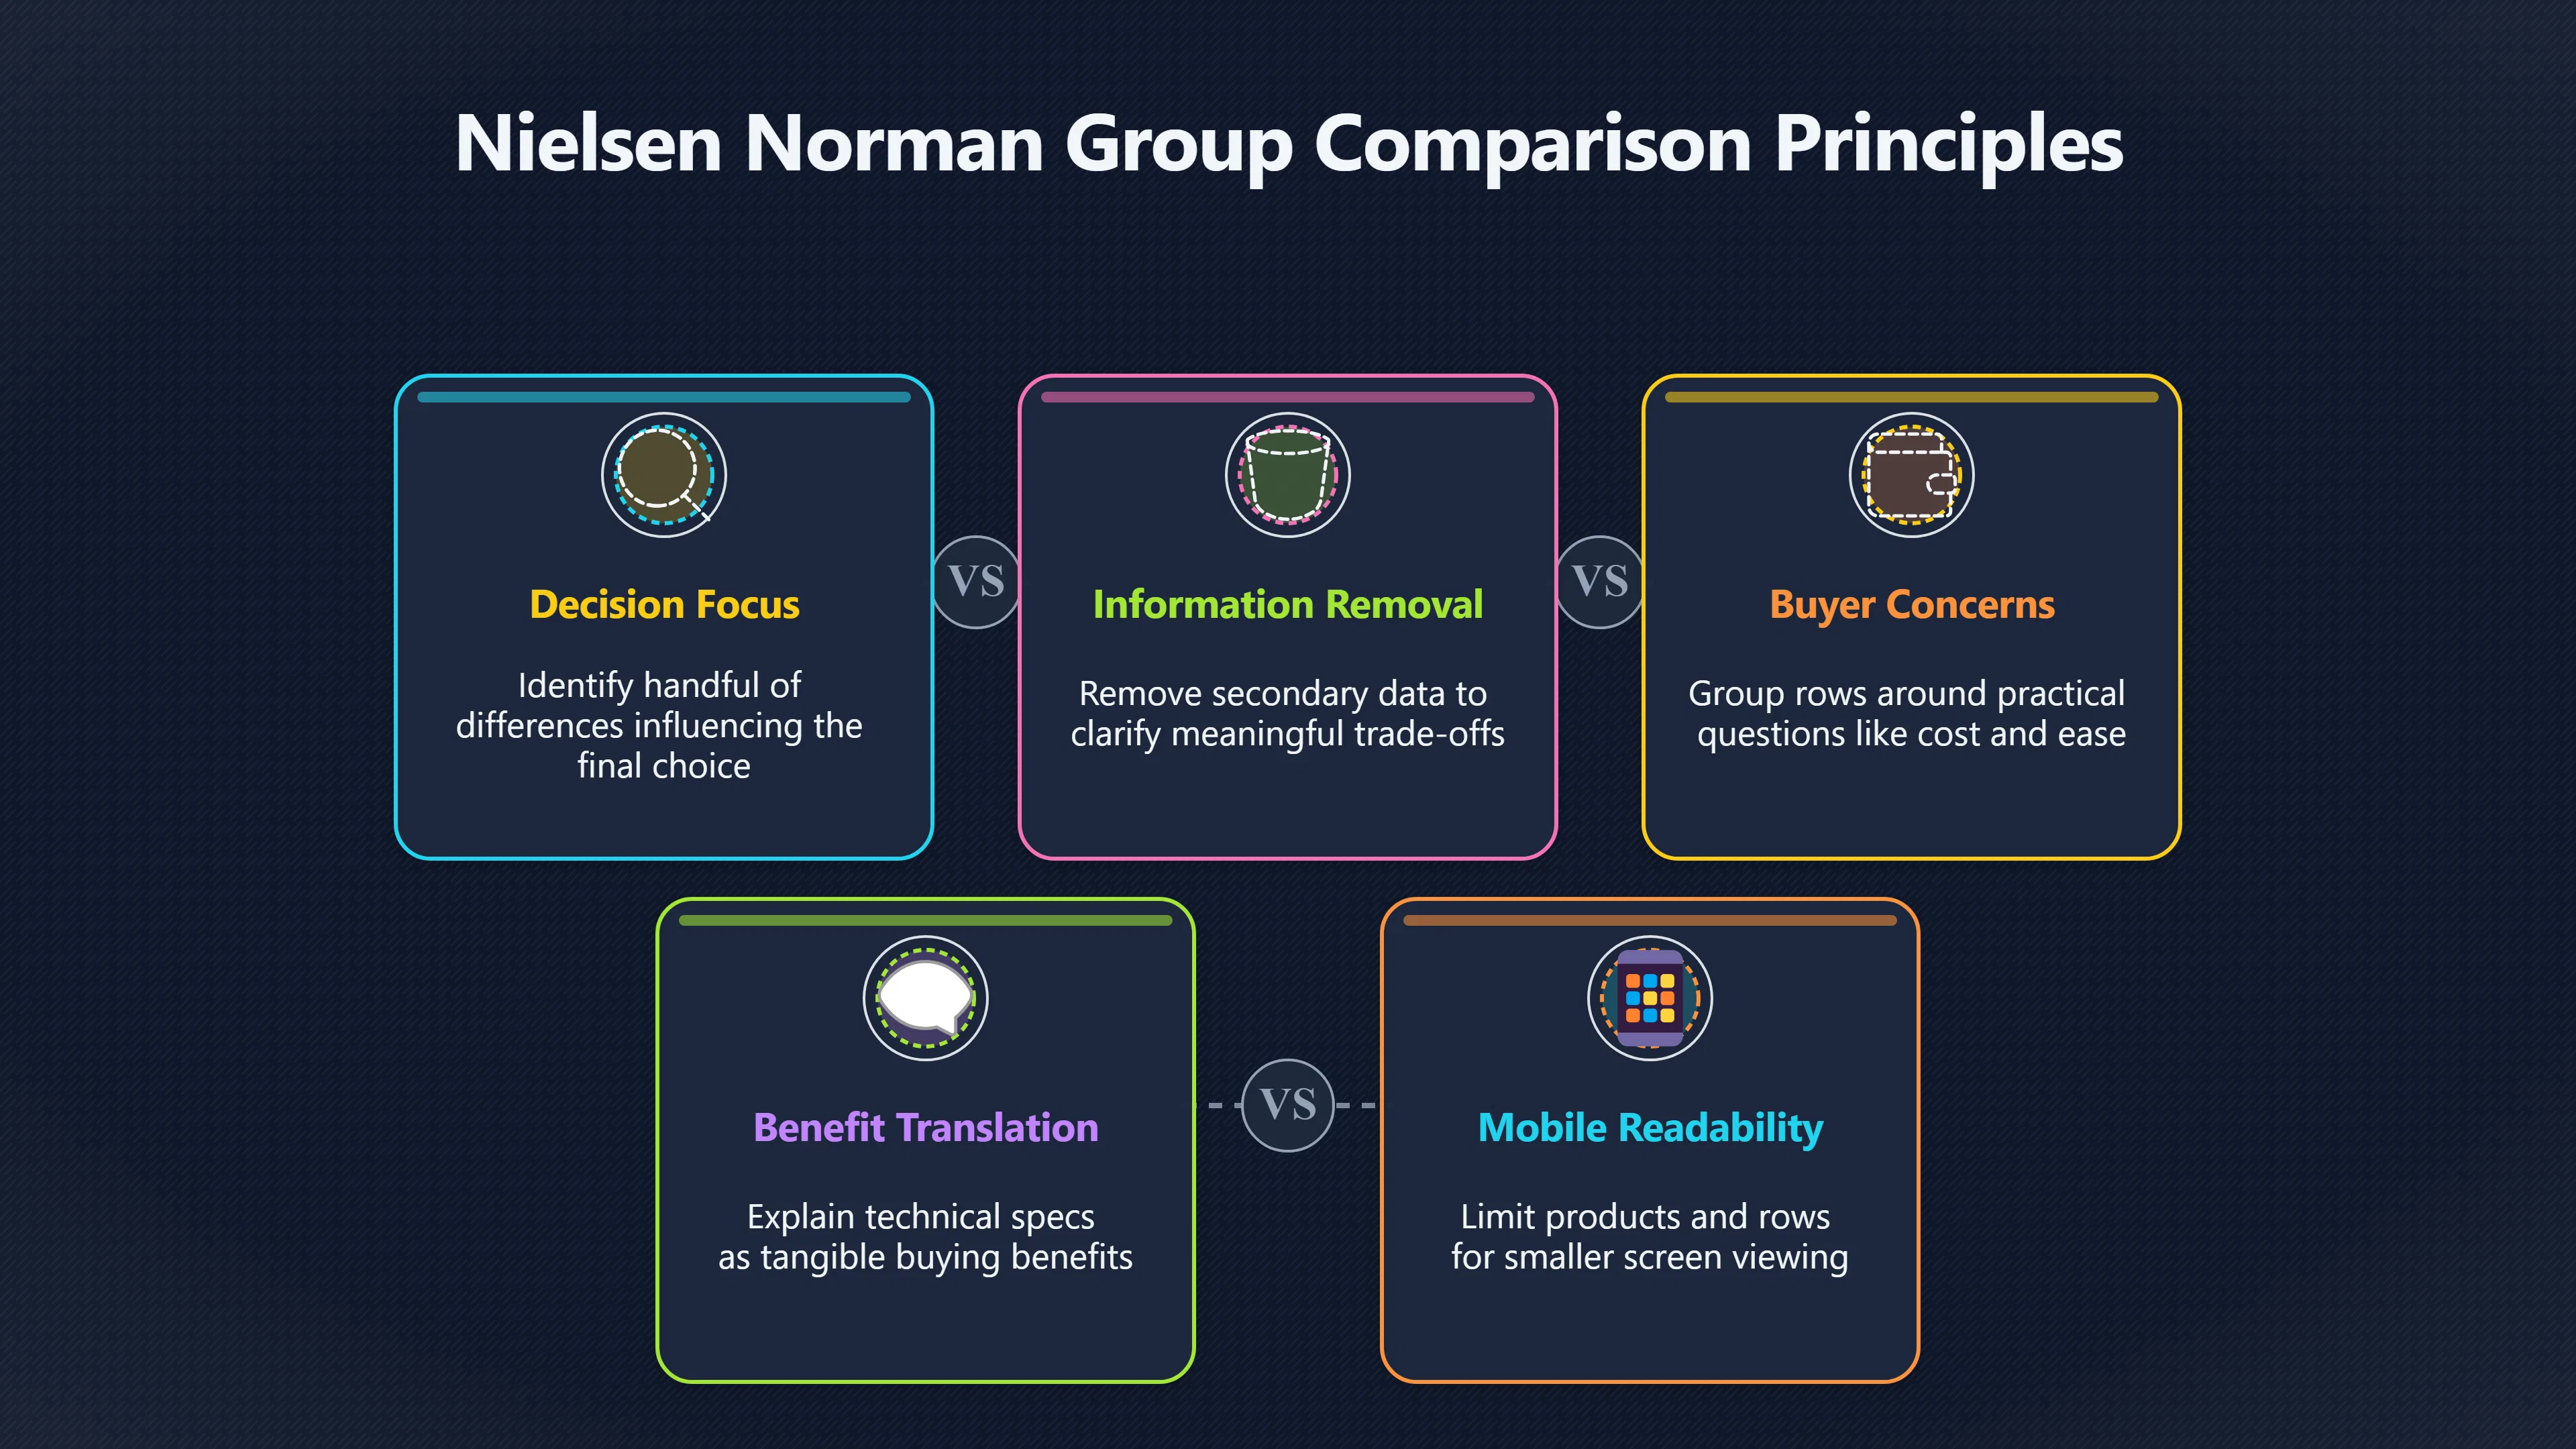
The best feature tables cut clutter by showing only the attributes that change a real buying decision.
On this page
- Choosing rows that affect the purchase
- Grouping features around buyer concerns
- Designing tables that work on mobile
Page outline Jump by section
Introduction
A feature table should make a buying decision easier, not create another research project. The most effective comparison pages do not attempt to list every specification from every product. Instead, they identify the handful of differences that genuinely influence whether one option is a better fit than another.
 For affiliate websites, this matters commercially as well as editorially. Readers who understand the important trade-offs are more likely to trust the recommendation and click through with confidence. Long, cluttered tables, by contrast, often bury meaningful differences beneath dozens of near-identical rows. User experience research shows that comparison tables work best when people are evaluating a small number of alternatives across attributes that actually influence the decision, rather than scanning exhaustive inventories of features. [Nielsen Norman Group]nngroup.comNielsen Norman Group Comparison Tables for Products, Services, and FeaturesNielsen Norman GroupComparison Tables for Products, Services, and FeaturesFebruary 9, 2024 — 9 Feb 2024 — They can be used to compare sim…
Why most feature tables become too long
Many affiliate publishers assume that adding more rows creates a more authoritative comparison. In reality, the opposite often happens.
Manufacturers publish extensive specification sheets because they must describe every aspect of a product. Buyers, however, rarely use all of those details. Someone choosing web hosting, VPN software or an email marketing platform usually cares about a limited number of questions:
- Will it do what I need?
- How much will it really cost?
- What are the important limitations?
- Which option is best for my situation?
Everything else is secondary.
Nielsen Norman Group notes that comparison tables are designed for decisions involving several meaningful attributes across a relatively small set of alternatives. When the table grows beyond that purpose, readers struggle to identify what actually matters. [Nielsen Norman Group]nngroup.comNielsen Norman Group Comparison Tables for Products, Services, and FeaturesNielsen Norman GroupComparison Tables for Products, Services, and FeaturesFebruary 9, 2024 — 9 Feb 2024 — They can be used to compare sim…
A useful comparison therefore removes information rather than accumulating it.
Choose rows that change the buying decision
Every row should answer a realistic purchasing question.
Instead of asking, “What features exist?”, ask, “Would a buyer change their choice because of this difference?”
For many affiliate niches, the highest-value rows include:
Useful rowWhy it mattersStarting priceSets the initial budget expectationRenewal priceShows long-term cost rather than introductory discountsFree trial or refund policyReduces purchase riskContract lengthReveals commitment requiredMain limitationsPrevents unpleasant surprisesCustomer support availabilityImportant if problems occurDevice or platform compatibilityEliminates unsuitable optionsKey integrationsCritical for software buyersStorage or usage limitsAffects practical valueBest suited forHelps readers self-select
By contrast, many rows add little value because almost every competitor gives the same answer. If every email marketing platform includes SSL encryption, or every VPN supports Windows, repeating those facts across an entire table contributes little to the decision.
The strongest tables therefore distinguish between decision features and background features.
Group features around buyer concerns
Readers rarely think in technical categories.
A hosting company may divide its specification sheet into networking, storage, management, security and infrastructure. Buyers typically think very differently:
- Can I afford it?
- Will it work for my website?
- Is it easy to use?
- Will it grow with me?
- What happens if something goes wrong?
Organising table rows around these questions reduces the effort required to interpret technical information.
For example, instead of mixing dozens of unrelated specifications together, a hosting comparison might group rows under:
Cost
Include the total price a customer is likely to pay, renewal pricing, included features and any compulsory extras. Showing realistic ongoing costs prevents misleading comparisons based solely on introductory offers.
Ease of use
Rather than listing every interface feature, compare practical differences such as guided setup, control panel quality, migration assistance and beginner friendliness.
Performance
Focus on measurable differences such as storage type, CDN availability, caching, uptime commitments or performance guarantees where suppliers publish them.
Support
Summarise support availability, response channels and managed services instead of overwhelming readers with every help centre feature.
Grouping related rows allows readers to concentrate on one concern at a time instead of scanning a long, visually repetitive spreadsheet.

Explain why differences matter
A table should not assume readers already understand technical terminology.
For example:
Poor rowBetter rowHTTP/3Faster loading on compatible connectionsDaily snapshotsAutomatic backups every dayUnlimited usersSuitable for growing teamsAPI accessCan connect with other business software
The feature remains accurate, but the explanation translates it into a buying benefit.
This approach also reduces the temptation to inflate the table with obscure specifications simply because competitors publish them.
Avoid false precision
Large specification tables often imply meaningful differences where none really exist.
For example:
- 99.95% versus 99.99% uptime
- 200 GB versus 250 GB storage
- 14-day versus 15-day free trial
These may matter in particular circumstances, but presenting every numerical distinction with equal visual weight can distract from more significant differences such as renewal pricing, support quality or missing functionality.
A good comparison table uses visual emphasis selectively. Highlight genuinely important differences rather than every minor variation.
Make recommendations without hiding trade-offs
Affiliate tables naturally guide readers towards particular products, but recommendations become more trustworthy when they acknowledge weaknesses.
For example:
ProductHonest summaryProduct ABest value, but renewal costs are highProduct BBetter support, although monthly pricing is higherProduct CCheapest overall, but lacks advanced automation
Readers recognise that no product is perfect.
Openly presenting drawbacks often increases confidence because the table resembles an independent buying guide rather than promotional copy.
Designing tables that work on mobile
A table that looks excellent on a desktop monitor can become almost unusable on a phone.
Government Digital Service guidance recommends keeping tables to a manageable size and avoiding oversized layouts that require excessive scrolling. Large tables are often better divided into smaller ones where possible. [guidance.publishing.service.gov.uk]guidance.publishing.service.gov.ukTables - GOV.UK content and publishing guidanceUse tables to present data or information that can be organised in a structured way, like…
For affiliate comparison pages, practical mobile improvements include:
- Limiting the comparison to three to five products.
- Restricting the number of visible rows to the most influential buying factors.
- Keeping product names visible while users scroll where practical.
- Using concise labels rather than lengthy descriptions.
- Placing a short explanation below the table instead of expanding every cell.
Nielsen Norman Group also recommends preserving context through techniques such as fixed headers and ensuring only meaningful information is displayed, since mobile screens make unnecessary complexity even harder to process. [Nielsen Norman Group]nngroup.comNielsen Norman Group Mobile Tables: Comparisons and Other Data TablesNielsen Norman GroupMobile Tables: Comparisons and Other Data TablesSeptember 17, 2017 — 17 Sept 2017 — Locking headers and allowing user…
The objective is not simply responsiveness but readability.

When a table is the wrong tool
Not every comparison benefits from a feature table.
Research from Nielsen Norman Group suggests tables are most valuable when readers are comparing a small number of similar alternatives across several meaningful criteria. They are less effective for inexpensive products, items chosen mainly for appearance, or situations where products are not direct substitutes. [Nielsen Norman Group]nngroup.comNielsen Norman Group Comparison Tables for Products, Services, and FeaturesNielsen Norman GroupComparison Tables for Products, Services, and FeaturesFebruary 9, 2024 — 9 Feb 2024 — They can be used to compare sim…
If two products differ dramatically in purpose, a narrative comparison may communicate the trade-offs better than forcing them into identical rows.
Likewise, if a buying decision depends heavily on personal circumstances, a simple recommendation framework—such as “Best for beginners”, “Best for professionals” and “Best value”—may be more useful than an enormous specification matrix.
A simple editorial test
Before publishing a comparison table, review every row by asking one question:
Would a reasonable buyer genuinely change their decision because of this information?
If the answer is no, remove the row.
The strongest affiliate comparison tables earn trust not by displaying the greatest quantity of information, but by presenting the smallest set of differences that allows a reader to make a confident purchase decision.
Amazon book picks
Further Reading
Books and field guides related to Why Most Feature Tables Are Too Long. Use these as the next step if you want deeper reading beyond the article.
Don't Make Me Think, Revisited
Explains how to simplify interfaces and reduce decision friction, directly supporting concise comparison table design.
The Design of Everyday Things
Covers human-centered design principles that help readers prioritize meaningful information over clutter.
Evil by Design
Demonstrates how presentation influences user decisions, relevant to effective comparison layouts.
Making Websites Win
Focuses on improving website decisions through clearer content and conversion-focused design.
eBay marketplace picks
Marketplace Samples
Live-tested eBay searches with available results related to this page.


Endnotes
-
Source: guidance.publishing.service.gov.uk
Link: https://guidance.publishing.service.gov.uk/formatting-content/text-formatting/tables/Source snippet
Tables - GOV.UK content and publishing guidanceUse tables to present data or information that can be organised in a structured way, like...
-
Source: analysisfunction.civilservice.gov.uk
Title: Data visualisation: tables
Link: https://analysisfunction.civilservice.gov.uk/policy-store/data-visualisation-tables/Source snippet
ernment Analysis Function19 May 2022 — This guidance provides advice on how to present and publish demonstration tables in HTML and do...
Published: May 2022
-
Source: nngroup.com
Title: Nielsen Norman Group Comparison Tables for Products, Services, and Features
Link: https://www.nngroup.com/articles/comparison-tables/Source snippet
Nielsen Norman GroupComparison Tables for Products, Services, and FeaturesFebruary 9, 2024 — 9 Feb 2024 — They can be used to compare sim...
Published: February 9, 2024
-
Source: nngroup.com
Title: Nielsen Norman Group3 Rules for Better Comparison Tables ([Video]({{ ‘video/’ | relative_url }}))
Link: https://www.nngroup.com/videos/ux-rules-comparison-tables/Source snippet
NN/GSuccessful comparison tables help people make decisions quickly. Simplicity, consistency, and informational are qualities of good com...
-
Source: nngroup.com
Title: Nielsen Norman Group Mobile Tables: Comparisons and Other Data Tables
Link: https://www.nngroup.com/articles/mobile-tables/Source snippet
Nielsen Norman GroupMobile Tables: Comparisons and Other Data TablesSeptember 17, 2017 — 17 Sept 2017 — Locking headers and allowing user...
Published: September 17, 2017
-
Source: nngroup.com
Link: https://www.nngroup.com/videos/comparison-tables/Source snippet
Comparison Tables: 5 Scenarios When Not to Use Them (Video)Consistency in content, scannability, and a simple layout are some of the most...
Additional References
-
Source: youtube.com
Link: https://www.youtube.com/watch?v=POsaV2YzRr8Source snippet
Comparison Tables: 5 Scenarios When Not to Use ThemComparison tables are most effective when they're used in the right context. Prevent u...
-
Source: weareyellowball.com
Title: how to design comparison tables that convert
Link: https://weareyellowball.com/guides/how-to-design-comparison-tables-that-convert/Source snippet
23 Dec 2025 — Create responsive, scannable comparison tables with clear differences, sticky headers, and smart design that drives better...
-
Source: foolproof.co.uk
Title: making product comparison work on mobile
Link: https://foolproof.co.uk/journal/making-product-comparison-work-on-mobileSource snippet
21 Mar 2014 — We discuss the design patterns most frequently used for product comparison and provides design suggestions to impr...
-
Source: youtube.com
Link: https://www.youtube.com/watch?v=2DPuRixwi9gSource snippet
How to Add Product Compare in WooCommerce (FREE) | Step-by-Step Tutorial...
-
Source: youtube.com
Title: How to Create an Affiliate Product Comparison Table in Word Press (Easy)
Link: https://www.youtube.com/watch?v=HeV5cnVWwpsSource snippet
How to create product showcase table/product comparison table in WordPress by Kadence blocks...
-
Source: youtube.com
Title: How to Add Product Compare in Woo Commerce (FREE) | Step-by-Step Tutorial
Link: https://www.youtube.com/watch?v=M5QD6fo0wnMSource snippet
How to Add an Affiliate Product Table in WordPress & Blogger | (Free & Responsive)...
-
Source: youtube.com
Title: Best Table Plugins for Word Press — Data, Design & Conversions
Link: https://www.youtube.com/watch?v=z47k3zvE5S0Source snippet
How to Create an Affiliate Product Comparison Table in WordPress (Easy)...
-
Source: youtube.com
Link: https://www.youtube.com/watch?v=F9XCkWzMqGk
Topic Tree